
-
1 Introduction
That a well-functioning judicial system is a crucial element in the development of a society is a truism very few would disagree with. However, the implications of this statement may become less obvious if one zooms in a bit. When is a judicial system ‘well functioning’? Is a system that is open to a large number of citizens but that reaches res judicata in a relatively long time considered to function better than a system that restricts access to justice but ensures quick dispute resolution? And what is the social ‘development’ that justice leads to? Does this refer to economic development alone? Or does it involve the ability to protect general values such as fairness and equality?
According to the European Commission, efficiency and quality of an independent judiciary secure and promote the rule of law as a shared value within the EU.1x European Commission, ‘2020 Rule of Law Report, COM(2020)580 final, 8. At the same time, well-functioning justice systems restore economic growth and foster competitiveness.2x European Commission, ‘The EU Justice Agenda for 2020 – Strengthening Trust, Mobility and Growth within the Union’, COM(2014)144 final. Timely judicial proceedings, affordability, and user-friendly access to justice are some of the essential features of effective justice systems, which in their turn are a precondition for rule-of-law enforcement and a requirement for growth.3x EU Justice Scoreboard 2021, 1. According to the Commission, these priorities are of such importance that they are expected to be delivered by any national judicial system, regardless of the legal tradition this belongs to. For this reason, they are expected to be supported by policies that, although still largely national, share a common set of values and purposes.
The EU Justice Scoreboard (hereafter Scoreboard) is the European Commission’s policy instrument adopted to shed light on these overarching policies. Created in 2013 by the Directorate-General for Justice and Consumers (DG Justice) and issued on an annual basis, the Scoreboard provides data on the functioning of EU national judicial systems.4x All editions are available at https://ec.europa.eu/info/policies/justice-and-fundamental-rights/upholding-rule-law/eu-justice-scoreboard_en (last visited 30 September 2021). The official description defines the Scoreboard as a non-binding monitoring instrument to map the functioning of national courts, draw up an inventory of potential challenges and incentivise judicial reforms through peer pressure and benchmarking exercises.5x EU Justice Scoreboard 2013, 3.
The Scoreboard contributes to these endeavours by offering quantitative and qualitative data on the performances of EU national courts articulated along three main lines: efficiency, quality and independence of justice. Overall, the Commission itself does not offer a theoretical framework on how efficiency, quality and independence are conceptualised on the Scoreboard. The indicators are primarily constructed on the standardsJustice Scoreboard indicators per category (aggregated 2013-2021)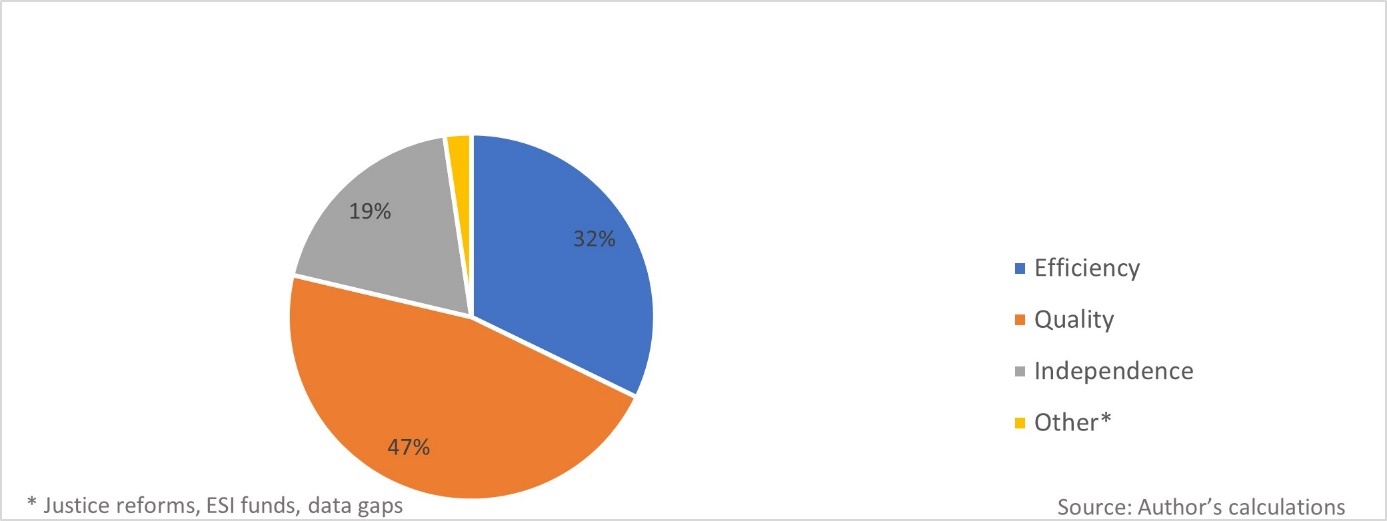
set by other bodies. The Scoreboard adopts the working method of The European Commission for the Efficiency of Justice (CEPEJ) and understands efficiency exclusively by trial length.6x CEPEJ Guidelines on Judicial Statistics (GOJUST) adopted by the CEPEJ at its 12th plenary meeting (Strasbourg, 10-11 December 2008), CEPEJ(2008)11. In this light, efficiency on the Scoreboard is conceptualised primarily as court effectiveness and not as economic efficiency.7x See also A. Dori, ‘The Supply and Demand of Justice: What Policy Implications from the EU Justice Scoreboard?’, III Yearbook of Socio-Economic Constitutions (2022) (forthcoming); A. Ontanu, M. Velicogna & F. Contini, ‘How Many Cases: Assessing the Comparability of EU Judicial Datasets’, 8 Comparative Law Review 1 (2017). The model of quality combines a wide range of factors broadly accepted by the scientific community and policymakers as relevant. The indicators reflect the common standards set by the Council of Europe (CoE), either by CEPEJ or by the Consultative Council of European Judges (CCJE), the advisory body of the CoE.8x CEPEJ, Checklist for promoting the quality of justice and the courts adopted by the CEPEJ at its 11th plenary meeting (Strasbourg, 2-3 July 2008); see also Opinion No 6 (2004) Consultative Council of European Judges (CCJE) on fair trial within a reasonable time and a judge’s role in trials taking into account alternative means of dispute settlement and Opinion No 11 (2008) on the quality of judicial decisions. They are developed around five measurement areas: (1) accessibility of justice; (2) financial and human resources; (4) assessment tools; (4) training and (5) standards on quality. For measuring judicial independence, the Scoreboard follows the classic distinction between perceived (de facto) and structural (de jure) independence. Perceived judicial independence covers subjective evaluations by different target groups (judges, business or the public). The normative basis of structural judicial independence is heavily influenced by the 2010 CoE Recommendation,9x Council of Europe, Judges: independence, efficiency and responsibility of judges, Recommendation CM/Rec(2010)12 and explanatory memorandum. which differentiates between external (from the legislative and executive branches) and internal (of individual judges from undue pressure from within the judiciary) independence.
Figure 1 displays how many indicators refer to each area as a percentage of the total to reveal the relative importance of the three areas from a quantitative perspective.Although the Scoreboard is gaining momentum and is used as a basis for academic studies and policymaking, targeted research on the specific information in that tool is limited.10x For the problems with the Scoreboard data collections see: R. Mohr and F. Contini, ‘Conflict and Commonalities in Judicial Evaluation’, 4 Oñati Socio-Legal Series 843 (2014); Dori, above n. 7; Ontanu, Velicogna & Contini, above n. 7; M. Fabri, ‘Methodological Issues in the Comparative Analysis of the Number of Judges, Administrative Personnel, and Court Performance Collected by The Commission for the Efficiency of Justice of the Council Of Europe’, 7 Oñati Socio-Legal Series 616 (2017); Ibid., ‘Comparing the Number of Judges and Court Staff across European Countries’, 26 International Journal of the Legal Profession 5 (2019); A. Nylund, ‘Comparing the Efficiency and Quality of Civil Justice in Scandinavia: The Role of Structural Differences and Definitions of Quality’, 38 Civil Justice Quarterly 427 (2019), A. Ontanu and M. Velicogna, ‘The Challenge of Comparing EU Member States Judicial Data’, 11 Oñati Socio-Legal Series 446 (2021). For more generic literature dedicated to the Scoreboard see: E. Van Rijckevorsel, ‘The European Union and the “Indirect Promotion of Its Values”: An Analysis of the Justice Scoreboard and the Roma Framework’, 3 Journal européen des droits de l’homme 444 (2016); A. Strelkov, ‘EU Justice Scoreboard: A New Policy Tool For “Deepening” European Integration?’, 27 Journal of Contemporary European Studies 15 (2019); B. Cappellina, ‘Legitimising EU Governance through Performance Assessment Instruments – European Indicators for a Judicial Administration Policy’, 2 International Review of Public Policy 141 (2020). This article focuses on one of the most significant parts of the Scoreboard data sets, the costs of the adjudication. In doing so, it considers the implications of those costs for both the supply (production costs in terms of resources and budget) and the demand sides of judicial services (court fees, lawyers’ fees and legal aid). This analysis is particularly relevant, as the Scoreboard considers costly (and lengthy) judicial proceedings as the main impediment(s) to access to justice and offers a benchmarking analysis with various data to depict member states’ performance in that regard.
The remainder of this article reviews the Scoreboard data collections on costs and assesses whether they can convey reliable and comparable information. To do so, Section 2 provides a brief history of the development of cost-relevant indicators throughout all the Scoreboard editions. Section 3 focuses on the selectionof data providers who feed the Commission with information, both in general and with a specific focus on costs. Section 4 analyses methodological limitations that affect the completeness, comparability and quality of the Scoreboard data sets on costs. Section 5 analyses how the Scoreboard tackles the uneasy triangular relationship between costs, efficiency and the rule of law. The article concludes with a summary of the relevant findings. -
2 The Development of Cost-Relevant Indicators
This section describes the development of the variables the Scoreboard adopted to report on the costs of adjudication. The purpose of the exercise is to set the basis for further reflections on the methodological issues surrounding judicial statistics, in general, and the Scoreboard, in particular.
For ease of exposition, the chronological analysis groups all Scoreboard editions (2013-2021) into three different periods. The first period gathers the two first editions when the Scoreboard was still, to some extent, an experiment in the making. The second period (2015-2019) collects the editions where the Scoreboard appeared to be a more mature tool, as made clear by the number and the complexity of the variables it included. The third period (2020 to the present day) is characterised by a further expansion of cost-relevant data to commercial (B2B) litigation. The following analysis addresses the Scoreboard data on costs, including public expenditure, legal aid and court fees. While those sources of funding are different in nature, they all provide coverage for the resources needed to run the judicial machine.2.1 The First Period (2013-2014)
In its very first edition, the Scoreboard pinpointed the difficulties in presenting comparable information on the performances of EU national courts. The unavailability of data for nearly all member states also explained the gaps that afflicted the Scoreboard data sets.11x EU Justice Scoreboard 2013, 20.
Given this difficulty, the 2013 Scoreboard included only one indicator related to the financial aspects of litigation. This was based on the understanding that adequate financial resources ensure efficiency, quality and independence of national justice systems and that investments in a well-organised justice system contribute to sustainable growth.12x Ibid., at 17. With this reasoning, the first edition presented the approved (while not necessarily executed)13x CEPEJ differentiates between ‘budget approved’, which has been formally authorised by law (by the Parliament or another competent public authority), and ‘budget implemented’, which covers expenditure actually incurred in the reference year; see CEPEJ Glossary, CEPEJ(2020)Rev1. annual total budget allocated to civil, commercial and criminal courts of member states, in absolute figures and per inhabitant.14x EU Justice Scoreboard 2013, Fig. 20.
The 2014 Scoreboard continued on the same path. Emphasis was laid on the negative correlation between efficient enforcement of contracts and transaction costs (particularly in the shape of opportunistic behaviour).15x EU Justice Scoreboard 2014, 4. The analysis of budgetary resources for the judiciary was complemented with more refined Eurostat data16x Ibid., at 7. on the actual total expenditure (including probation system and legal aid), both per capita and as a percentage of the GDPs.17x Ibid., Fig. 25-26.2.2 The Second Period (2015-2019)
As anticipated in the previous edition,18x Ibid., at 27. the 2015 Scoreboard relied extensively on new sources and expanded the indicators compared with the past years. Consequently, it was also enriched with additional cost-related data and more precise key findings and time series of member states.
To begin with, the modernisation of public administration and assessment of the quality of public services became a priority for all member states. In this general context, the Commission has shown particular interest in fostering structural reforms,19x European Commission, ‘Europe 2020, A Strategy for Smart, Sustainable and Inclusive Growth’, COM (2010) 2020 final; For the cryptic notion of ‘structural reforms’; see A. Crespy and P. Vanheuverzwijn, ‘What “Brussels” Means by Structural Reforms: Empty Signifier or Constructive Ambiguity?’, 17 Comparative European Politics 92 (2019). including the policy area of justice,20x EU Justice Scoreboard 2015, 4; European Commission, ‘Communication from the Commission, Annual Growth Survey 2015’, COM(2014)902 final; see also B. Hess and G. Dimitropoulos, ‘Judicial Reforms in Luxembourg and Europe: International and Comparative Perspectives’, in B. Hess (ed.), Judicial Reforms in Luxemburg and Europe (2014) 11, at 18. which brought the focus of the Commission policy closer to economic efficiency – as opposed to rule-of-law protection as such.21x In this respect scholars have pointed out in the broader EU economic governance the paradoxical challenge of ‘doing better with less’ or, in other words, providing high-quality services in times of budgetary austerity; see R. Peña-Casas, S. Sabato, V. Lisi & C. Agostini, ‘The European Semester and Modernisation of Public Administration’, European Social Observatory 5-6 (December 2015).
To provide a mapping of the efforts undertaken by the member states, the Scoreboard introduced a new indicator presenting the scope, scale and state of play of judicial reforms across the EU.22x EU Justice Scoreboard 2015, Fig. 1. Domestic reforms were classified into different categories depending on their primary objectives. Next to operational measures (e.g. case management, promotion of alternative dispute resolution (ADR), use of information and communication technology (ICT)) and more structural initiatives (e.g. restructuring of the organisation of courts, simplification of procedural rules), legislative activities regarding court fees, legal aid and legal services regulation constituted separate categories. The combined reading of the number of countries undergoing reforms and the plurality of the addressed policy directions enabled readers to understand ‘who was doing what’ in the policy area of justice.
Regarding the allocation of financial and human resources for the judiciary, data from CEPEJ and Eurostat on consecutive years sought to highlight trends in the management of budgetary constraints.23x Ibid., Fig. 38-41. Cognisant of the methodological limitations that afflict cross-country comparisons of judicial data,24x See Section 4.2. the Commission did not submit a single set of parameters to benchmark public budgets. Instead, it underlined the importance of better regulation toolboxes, which could improve the quality of policy impact assessments through tighter monitoring and evaluation of court activities.25x EU Justice Scoreboard 2015, 36.
The 2015 edition drew a direct link between adequate financial resources and structural judicial independence for the first time.26x Ibid., at 38. A new indicator presented the criteria applied to the determination of the resources invested in law courts (e.g. historic or realised costs, number of incoming and resolved cases, anticipated costs or needs and requests by a court) and the specific branch of government (judiciary, legislature and executive) deciding on their allocation.27x Ibid., Fig. 50.
Considering the requirement of access to justice under Article 47 CFR, legal aid guarantees effective judicial protection to citizens lacking sufficient financial means.28x Ibid., at 32, 36. With this reasoning, the 2015 Scoreboard presented CEPEJ data on the annual public budget allocated to legal aid per capita and uncovered major discrepancies between the south and the north EU states.29x Ibid., at 32 and Fig. 39.
Finally, cost-related variables started to appear more often as components of new aggregated indicators. When mapping national practices in courts’ communication policies, the Scoreboard also considered the availability of online information on litigation costs and legal aid for citizens30x Ibid., Fig. 26. and revealed many deficiencies in the member states.31x Ibid., at 36. Availability of legal aid for ADR costs, refund of court fees in successful ADR outcomes, and non-mandatory participation of lawyers in ADR schemes were examined as incentives to promote ADR use.32x Ibid., Fig. 34. Last but not least, free-of-charge access to judicial decisions was a variable for assessing the national practices in the publication of courts’ decisions.33x Ibid., Fig. 29.
The 2016 Scoreboard further explored the connection between structural independence and distribution of public resources with a new indicator. It focused on national Councils for the Judiciary and their managerial powers to allocate budget to courts.34x EU Justice Scoreboard 2016, Fig. 50-51.
The most significant novelty in 2016 was the incorporation of data on legal aid domestic conditions. In particular, that exercise factored in, for the first time, the income level of individuals compared with their countries’ average to provide a more calibrated view on access to justice.35x The incorporation of domestic living and economic conditions when assessing national legal aid schemes has also been highlighted by the German Bundesrat, BR-Drucksache 92/15, para.6. The new indicator was created with the help of the Council of Bars and Law Societies of Europe (CCBE).36x More on the Scoreboard data providers in Section 3. It combined information on legal aid schemes and domestic economic conditions.37x EU Justice Scoreboard 2016, Fig. 20. For most member states, personal income appeared to be the dominant factor in access to legal aid. The indicator was designed on the basis of a narrow scenario of a consumer dispute of an absolute value of 3,000 EUR for a single 35-year-old employed applicant with a regular income. The CCBE members replied to questionnaires and provided information on the eligibility criteria for legal aid. The indicator presented the differences (in %) between the income thresholds used by the member states to grant legal aid, on the one hand, and the Eurostat at-risk-of-poverty threshold, on the other. It also provided information on whether the legal aid coverage for the litigation costs was full or partial.
The 2017 edition moved beyond general budgetary questions38x EU Justice Scoreboard 2017, Fig. 32-34. and explored the connections between court effectiveness and resources. Following the mapping of quality standards of the previous year,39x EU Justice Scoreboard 2016, Fig. 31-32. it offered an overview40x EU Justice Scoreboard 2017, Fig. 47-49. of the measures triggered when courts failed to comply with standards on time limits,41x ‘Time limits’ are understood as quantitative deadlines for courts; ibid., at 32. time frames42x ‘Time frames’ are understood as measurable targets and practices, e.g. specifying a predefined share of cases to be completed within a certain time; idem. and backlogs.43x ‘Backlogs’ are understood as the number of pending cases after a certain predefined amount of time; idem. In this regard, some member states reportedly considered the allocation of additional financial and human resources among the remedies to deploy when the judiciary fell short of delivering timely decisions. The Commission was not suggesting that footing the bill and increasing the total expenditure should be the governments’ reaction to lengthy judicial proceedings. However, by benchmarking this option and presenting national trends in this field, it showed its intention to expand the surveillance beyond general budgetary questions and to include qualitative assessments of the allocation of public resources, especially for justice systems in critical conditions.
In the fields of legal aid and court fees, the 2017 edition introduced two novelties. Since the CEPEJ data on the annual public budgets allocated to legal aid (per inhabitant) had not been proven particularly effective for cross-country comparisons, they have been omitted. Instead, the Scoreboard made broader use of the CCBE indicator on legal aid thresholds.44x Ibid., Fig. 21. The indicator maintained the main features of the previous edition but broadened its scope to include both a high- and a low-value consumer dispute. The high-value consumer claim was set with an absolute amount (6,000 EUR). The low-value claim was defined in relative terms (60% of the national median income). In absolute numbers, the low-value claim ranged between 110 EUR in Romania and 1,716 EUR in Luxemburg.
The second major novelty on costs in 2017 was the incorporation of data on court fees for consumer disputes.45x Ibid., Fig. 22. The new CCBE indicator used the same scenarios as with legal aid thresholds. It displayed the court fees paid for the initiation of proceedings (in % of the claim value) for high- and low-value consumer claims. Unfortunately, no further information was available on the criteria and the methods followed by the member states when setting the prices and calculating court fees.
In 2018, no novelties were introduced regarding costs. The only visible change was related to ICT and legal aid. Drawn from the experiences of the past editions, the synthetic indicator on information for the public about the justice systems started to include as a separate variable the availability of interactive online simulation tools to assess eligibility for legal aid.46x EU Justice Scoreboard 2018, Fig. 25.
The 2019 edition did not include significant changes, either. A new indicator with data from Eurostat classified the total public expenditure on law courts into four big groups: wages and salaries of judges and court staff, operating costs, fixed assets, and others.47x EU Justice Scoreboard 2019, Fig. 31. Each of them was displayed as a percentage of the total courts’ budget. Legal aid fell under operating costs for goods and services, along with building rentals and energy costs for courts (but without further distinction among the different components).
The CCBE indicator on the eligibility for legal aid started to aggregate the data from the two individual scenarios (high- and low-value consumer claims).48x Ibid., Fig. 21. No explanation for this methodological change was given, although its drawbacks were immediately visible. The variables shown on the chart were reduced to the applicable income threshold (in % compared with the Eurostat poverty threshold) and the type of coverage costs through legal aid (full or partial). As a consequence, the findings became more reader-friendly, but some information was lost.2.3 The Third Period (2020-2021)
The 2020 Scoreboard continued presenting data on public investments in the judicial systems as a proxy for financial resources allocated to the judiciary.49x EU Justice Scoreboard 2020, Fig. 32-34. By contrast, the indicators examining the budget allocation and judicial independence and the follow-up measures for non-compliance with performance benchmarks and time standards were omitted. No explanation was given for this change.
When assessing the costs of proceedings for litigants, next to consumer disputes,50x Ibid., Fig. 23-24. the 2020 edition turned to commercial cases as well. Given the importance of contracts enforcement for economic development51x Ibid., at 28. and the cost-shifting principle52x In some states the recovery of court fees is decided on a case-by-case basis, e.g. Portugal and Romania; others do not foresee the full recovery of court fees, e.g. Greece and Hungary; ibid., 24. for deterring or encouraging low- or high-probability lawsuits, respectively, CCBE developed two new indicators on the financial aspects of litigation between companies (B2B). Both indicators used the same hypothetical scenario of a cross-border commercial dispute regarding the contract enforcement for a claim of 20,000 EUR. The first indicator displayed the court fees for the initiation of the proceedings in absolute values.53x Ibid., Fig. 25. The second indicator showed the amounts of recoverable lawyers’ fees.54x Ibid., Fig. 26. In this hypothetical set-up, the legal services provided by lawyers during the litigious phase55x Revocability of legal costs occurred during the pre-litigious phase is not foreseen in all member states, and those costs were consequently not included; ibid., at 29. (without clerical costs and VAT) amounted to 3,300 EUR, i.e. 1,650 EUR for each party. The indicator further divided the member states into three big categories depending on the system of recoverable lawyers’ fees.
The latest publication of 2021 continued reporting the annual trends on public and private resources allocated to justice and legal services. Additionally, as announced by the Commission,56x European Commission, ‘Digitalisation of Justice in the European Union: A Toolbox of Opportunities’ COM(2020)710 and accompanying SWD(2020)540. the Scoreboard has been substantially augmented with more data on the impact of the ongoing pandemic crisis on the digitalisation of judicial and legal proceedings.57x See EU Justice Scoreboard 2021, 5 and Fig. 39-47; See also A. Biard, J. Hoevenaars, X. Kramer & E. Themeli, ‘Introduction: The Future of Access to Justice – Beyond Science Fiction’, in X. Kramer, A. Biard, J. Hoevenaars & E. Themeli (eds.), New Pathways to Civil Justice (2021) 1, at 15-16. The focus was placed on digital solutions that can tangibly facilitate access to justice and reduce costs for citizens, including the availability of online payments of court charges58x EU Justice Scoreboard 2021, Fig. 44. and ADR fees59x Ibid., Fig. 27. or electronic service of documents.60x Ibid., Fig. 44. -
3 The Information Providers for the Scoreboard Data
As in any fact-finding exercise, looking at the procedure for collecting information is key to understanding the contents and the quality of the outcome, as this is inevitably dependent on the input. This section focuses on the data providers, which annually feed the Commission with the requested data, and explains how such data are processed in the preparation of the Scoreboard. At the same time, it sheds light on the different approaches
Justice Scoreboard indicators per provider (aggregated 2013-2021)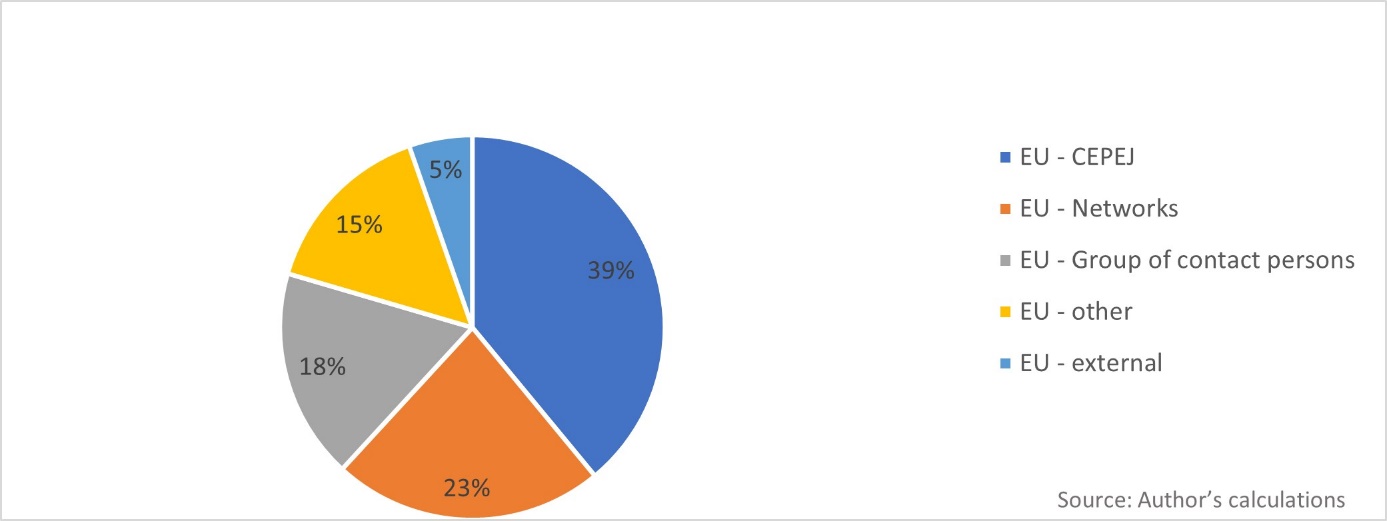
that the tool has been following regarding costs from the very origin of its process.
3.1 The Role of Information Providers in General
The Scoreboard relies primarily on various EU-internal channels or EU-based entities, which collect all requested data on behalf of the Commission. Aggregated calculations (see Figure 2) show that most of the Scoreboard data have been obtained from several EU-based providers. Only exceptionally does the Scoreboard reproduce information from EU-external sources.61x World Bank’s Doing Business Report (DBR) or the Global Competitiveness Report (GCR) of the World Economic Forum.
The CEPEJ of the CoE has been, since 2002, the leading actor in Europe in assessing the functioning of judicial systems through legal indicators.62x CEPEJ was established in 2002 to promote with various activities (e.g. reports, guidelines, recommendations) the exchange of best practices and the creation of a common legal culture among CoE member states; see Resolution Res(2002) 12 of the Committee of Ministers, Appendix 1, Statute of the European Commission for the Efficiency of Justice (CEPEJ), Arts. 1-3. In 2011, the Commission mandated CEPEJ to analyse the EU judicial systems annually.63x CEPEJ, 18th plenary meeting (7-8 December 2011), Abridged Report. In 201364x For the uneasy cooperation between CEPEJ and the DG Justice, see M. Velicogna, ‘The EU Justice Scoreboard and the Challenge of Investigating the Functioning of EU Justice Systems and Their Impact on the Economy of the Member States’, Paper prepared for the ‘Società Italiana di Scienza Politica’ (SISP) Conference (September 2013). CEPEJ started to publish its yearly Studies and feed the Scoreboard with figures and findings. CEPEJ counts as the biggest data provider with a share equal to 39% of the consolidated amount of Scoreboard data throughout the years, with very active involvement in the production of indicators on efficiency.
Various types of European networks created under the aegis of the European Commission constitute the second-biggest provider, with a 23% total share of all data. In this category fall primarily EU associations of judicial professions.65x For the increasing role of EU judicial networks on EU justice policymaking, see S. Benvenuti, ‘National Supreme Courts and the EU Legal Order: Building a European Judicial Community through Networking’, 6 Perspectives on Federalism 1 (2014); M. Claes and M. Visser, ‘Are You Networked Yet? On Dialogues in European Judicial Networks’, 8 Utrecht Law Review 100 (2012); D. Piana, Judicial Accountabilities in New Europe: From Rule of Law to Quality of Justice (2010), at 37-8. The Commission enhanced the cooperation with the European Network of Councils for the Judiciary (ENCJ), the Network of Presidents of the Supreme Courts of the European Union, and the European Judicial Training Network (EJTN). They have all contributed to the expansion of the Scoreboard data sets, especially in the fields of quality and independence of justice. Starting in 2016, the DG Justice also included the CCBE as a new actor among EU networks, from the demand side of judicial services. CCBE is an international non-profit association representing European bars and law societies from the EU, the European Economic Area (EEA) and wider Europe with more than 1 million EU lawyers as members.66x More at www.ccbe.eu/ (last visited 30 September 2021). CCBE has been the sole provider of all indicators on legal aid, court and lawyers’ fees of the latest Scoreboard editions.67x See also below Section 3.2.
The ‘group of contact persons on national justice systems’ is the third biggest data provider. It is an expert group established in 2013 by DG Justice to assist the Scoreboard development and promote the exchange of best practices on data collection.68x EU Justice Scoreboard 2015, 4. Each member state designates one member from the judiciary and one from the Ministry of Justice. The group holds regular meetings69x Information available at the Register of Commission’s Expert Groups and Other Entities at https://ec.europa.eu/transparency/regexpert/index.cfm?do=groupDetail.groupDetail&groupID=3022 (last visited 30 September 2021). and since 2015 had contributed 18% of the total amount of the Scoreboard data.
The remaining data are obtained from a variety of other EU sources. Eurobarometer is the series of pan-European opinion polls on the attitude of EU citizens70x Eurobarometer was created in 1974 to boost the European Union’s political project; see S. Signorelli, ‘The EU and Public Opinions: A Love-Hate Relationship?’, 93 Notre Europe Studies & Reports (2012), at 12; S. Nissen, ‘The Eurobarometer and the Process of European Integration’, 48 Quality & Quantity 713 (2014). and has offered, since 2016, the most quoted ScoreboardThe providers of all Scoreboard indicators (weight per year)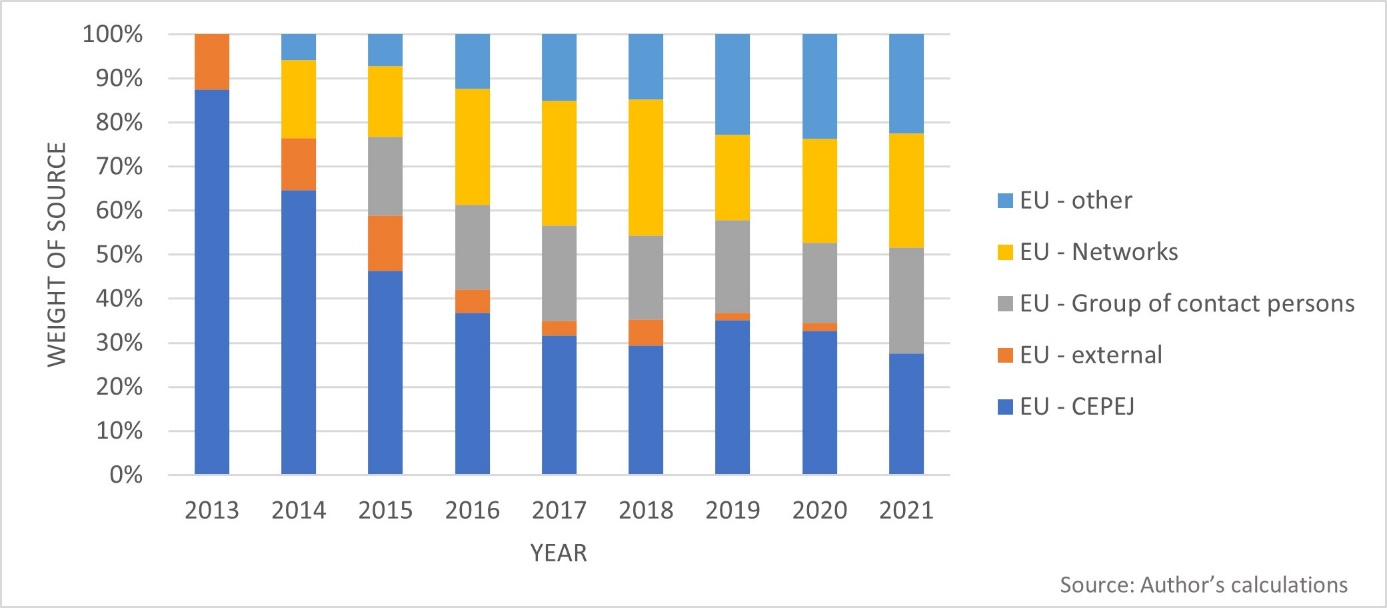
indicators by scholars and media, those on perceived judicial independence among EU citizens and businesses. Eurostat, the statistical office of the EU, provides figures on the public budgets allocated to the judiciaries. Data in EU law fields crucial for the internal market, such as money laundering or electronic communications, is obtained by institutions and organisations active in the specific respective fields.71x E.g., the ‘Expert Group on Money Laundering and Terrorist Financing’ or the ‘Communications Committee’ (COCOM).
In its initial phase, the Scoreboard relied heavily on the methodology, intellectual support and knowledge transfer by CEPEJ. As noted previously, CEPEJ counts as the biggest contributor to the Scoreboard data sets. This static information says little, however, about the dynamics of such involvement. CEPEJ participation has decreased progressively over time also owing to the expansion of indicators in quality and independence and the inclusion of other providers in these two fields. This steady decline has brought CEPEJ from its initial leading role as a Scoreboard input, which translated into 87% of the total sources, to its much smaller current stake, down to 27% (Figure 3).3.2 Information Providers and Data on Costs
Among the various data providers, only a few contribute cost-related data. CEPEJ and Eurostat offer data primarily on public budgets for the judiciaries. The ‘group of contact persons’ uses cost variables to assess aspects of the quality of justice systems. ENCJ explores the connections between resource allocation and its impact on judicial independence. Finally, CCBE is the sole provider of data on the effectiveness of legal aid and the amount of litigants’ fees paid as court charges or lawyers’ fees.
The following chart (Figure 4) shows the participation of each provider in the area of costs per year of publication and reveals some interesting trends. The most blatant one is the decommissioning of CEPEJ. From being the sole provider of cost-relevant data of the first edition, CEPEJ gradually lost significance and entirely disappeared after 2016. The same declining trend characterises the use of ENCJ data. By contrast, data from CCBE followed an increasing trend.3.3 The Selection of Information Providers: A Neutral Exercise?
The weight of the providers per year of publication analysed at the end of the last subsection (Figure 4) also gives indications of the changing level of trust placed by the Commission on those providers. More importantly, it also highlights the lack of transparency in setting the Scoreboard’s benchmarks, selecting the sources and collecting the data.
Overall, the creation and development of the Scoreboard do not appear entirely transparent. This lack of accountability by the Commission ranges from fundamental issues, such as the states’ involvement in the Scoreboard blueprint, to questions on the indicators’ design and data presentation. Besides very few generic statements on the indicators’ objectives and methodology, the Commission is very reluctant to explain the reasons behind the selection of providers, all the more compared with the available alternatives.
Adjudication costs offer a good example. The CEPEJ annual Studies contain data also on legal aid and litigants’ fees.72x CEPEJ, Study on the Functioning of Judicial Systems in the EU Member States – Facts and Figures from the CEPEJ Questionnaires 2010 to 2018, Part 1, CEPEJ(2019)17 rev4. The reasons why such data have been disregarded can only be speculated. The first Scoreboard editions largely duplicated CEPEJ data on efficiency and quality. A presentation of (more) CEPEJ data in the area of costs might have provoked additional criticism by those member states, which have openly questioned the usefulness of the Commission’s initiative from its very beginning.73x More on that in Section 4.1.1. However, it would have significantly enriched the Scoreboard’s output when measuring adjudication costs.The providers of cost-relevant indicators (weight per year)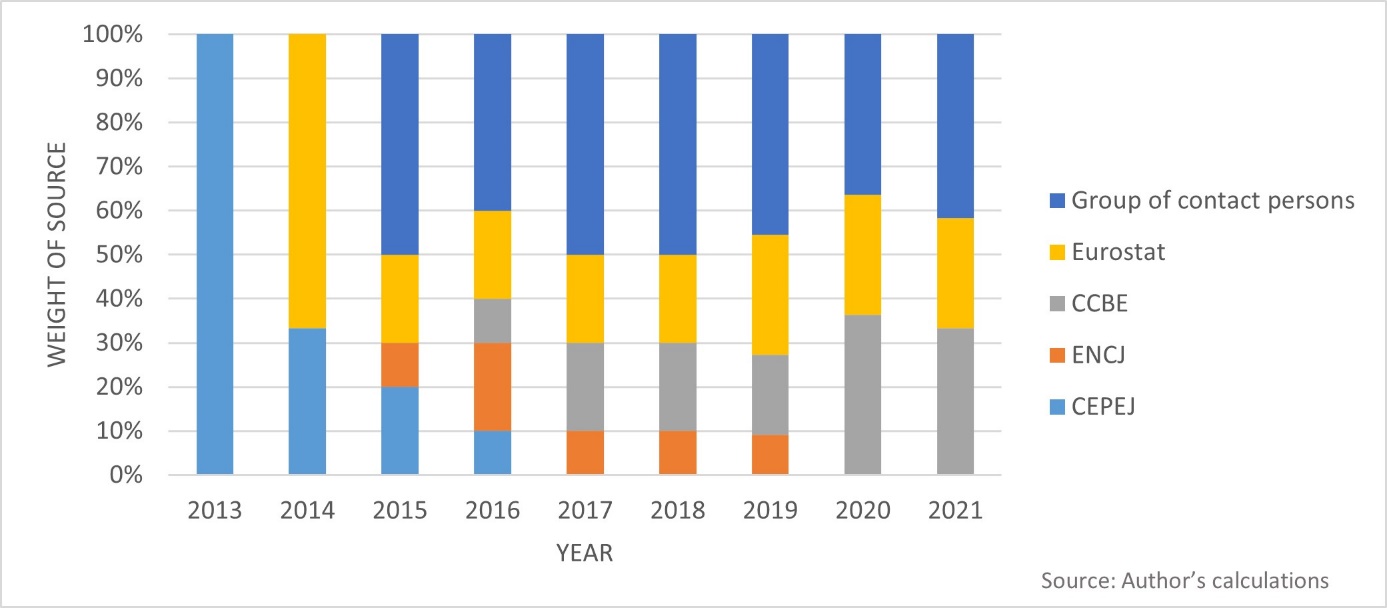
A possible explanation might, therefore, be the cautious CEPEJ approach when publishing its data. CEPEJ follows a very transparent methodology. Its complete data sets are fully accessible to the public with online interactive tools.74x Available at www.coe.int/en/web/cepej/cepej-work/evaluation-of-judicial-systems (last visited 30 September 2021). Additionally, CEPEJ publishes its annual Studies in full length compared with the Scoreboard and includes many caveats and extensive explanatory notes per member state.
Furthermore, the policy choice to rely solely on lawyer members of CCBE for assessing the effectiveness of legal aid schemes is not obvious, especially considering the existence of alternative official channels such as the relevant judicial authorities through the CEPEJ national correspondents or the ‘group of contact persons’ (with members from the judiciary and Justice ministries). Unfortunately, answers to these methodological concerns could not be found in CCBE documents either. The questionnaires, the methodology, the dataset or any draft analysis of the findings are not publicly accessible. The Scoreboard presents only a one-page-long description of the CCBE findings together with very few guidelines on how to read the indicator and some methodological caveats cramped in footnotes. The ‘group of contact persons’ follows a similar approach and does not publish its data. Therefore, when confronted with the Scoreboard data on costs, readers are left usually with figures and charts. These offer a preliminary orientation but do not always facilitate thorough research. -
4 The Challenges of Measuring Costs: The Scoreboard Methodology
Since its first 2013 edition, the Scoreboard pinpointed the difficulties in presenting performance indicators related to judicial services in a comparative context. Addressing the data gaps became the main challenge for the Commission.75x EU Justice Scoreboard 2013, 20. Despite the objective difficulties in gathering comparable, homogeneous and reliable data, the Commission moved forward with its more-is-better approach to further develop the Scoreboard. Relying on new synergies with several actors, from 2015 onwards it began incorporating additional indicators (Figure 5).
The same growth is also reflected in the field of adjudication costs. The 2015 edition was enriched with additional information on costs and more precise key findings, including legal aid budgets or criteria for determining courts’ resources.76x See above Section 2.2. Overall, the total number of cost-related indicators tripled in 2015 and followed a slightly increasing trend later (Figure 6).
However, the increase in the available information also revealed various practical and methodological limitations in the Scoreboard data sets.77x For the problems of the Scoreboard data collections see the literature references above n. 10. For the sake of exposition, such shortcomings may be grouped into two different categories: completeness and comparability. However, as this section will explain, the Scoreboard indicators on costs are not equally affected by both problems.The progression of all Scoreboard indicators The progression of cost-relevant indicators
Section 4.1 deals with the issue of completeness and shows the reasons why the Scoreboard has not always been able to provide a complete picture of the quantities it planned to measure. Section 4.2 addresses the problem of comparability.
4.1 The Completeness of Data on Costs
4.1.1 Loopholes: Voluntary Participation of Member States
The first limitation that significantly affects the completeness of the Scoreboard data sets is related to the nature of this periodical monitoring exercise. The Scoreboard is a soft-law instrument based on the voluntary participation of all member states. National authorities are not obliged to comply with the Commission’s requests for data. Therefore, the completeness of the Scoreboard annual data sets is always conditional on the overall attitude and free cooperation of each member state. In this light, data gaps may often occur owing to the lack of contribution from the member states.78x EU Justice Scoreboard 2013, 20; EU Justice Scoreboard 2021, 3.
Overall, the Commission tends to ascribe the occurrence of the data gaps primarily to the technical difficulties in collecting comparable data, the insufficient domestic statistical capacity, and the heterogeneity of national statistics.79x Idem. This is true, as also demonstrated in the Scoreboard footnotes. When complete data sets are publicly accessible, as is the case with the CEPEJ Studies, it is also often revealed that data gaps occurred, for instance, because the requested information was not available at the national level or because the authorities failed to provide on-time data meeting the specific quality requirements for inclusion.
Nevertheless, the fact remains that the member states’ response rate to the Commission’s annual requests for data varies. While some countries are more willing to collaborate, others refuse. Given the lack of compliance mechanisms, naming and shaming together with peer pressure appears to be the main incentives for the member states to participate in the Commission’s annual monitoring exercise. And in this respect, not all member states respond equally.
The fear that the Scoreboard may lead to the promotion of a one-size-fits-all EU justice system80x N. Nielsen, ‘EU Justice Scoreboard Upsets Some Member States’, EUobserver, 14 March 2014. and the top-down Commission’s approach when designing and setting the tool in motion81x B. Cappellina, Quand la Gestion S’Empare de la Justice: De la Fabrique Européenne aux Tribunaux (2018), at 241. have upset some member states, which have pleaded for a more intense dialogue during the Scoreboard preparations.82x Council of the European Union, 3279th Council Meeting – Justice and Home Affairs, Brussels, 5-6 December 2013, Press Release 17342/13, 18. Some member states repeatedly denied sending data to Brussels (e.g. Belgium) or boycotted the Scoreboard project in its entirety (e.g. the United Kingdom). Refusals were based on various grounds, from questioning the EU’s competence (since the Scoreboard is not limited to data on the implementation of EU law or cross-border cases but encroaches on national statistics, and recently also on the whole organisation and management of prosecution services83x E.g., EU Justice Scoreboard 2019, Fig. 55-57 (structural independence arrangements for prosecution services).) to arguments of national administrative incapacity, limited resources, political expediency, or even usefulness of the Commission’s initiative, as the Scoreboard, at least in its first editions, had essentially duplicated CEPEJ figures.84x See, e.g., Parliament of the United Kingdom, House of Commons European Scrutiny Committee, 47th Report of Session 2013-2014, 15 May 2014, 25 MOJ (35888) (34822). To be sure, other member states (such as Germany) have been equally critical of the Commission’s initiative, yet they decided to cooperate and engage in an annual dialogue with the Commission, suggesting improvements for the Scoreboard.85x From the first Scoreboard edition the German Bundesrat (i.e. legislative body that represents the sixteen federated states of Germany) issued Opinions (Stellungnahmen) commenting on the Commission’s initiative: see BR-Drucksache 244/13, 171/14, 92/15, 173/16, 279/17, 416/18, 294/19, 526/20.
The unavailability of data has also raised the attention of journalists attending the annual Scoreboard press conferences. Questions on data gaps were raised both in general terms86x E.g., EU Justice Scoreboard 2016 press conference, 11 April 2016; the video is available on the Commission’s audiovisual services portal (Reference: I-119359). and for specific countries, as was the case with the Polish lack of cooperation during the controversial judicial reforms of 2017.87x EU Justice Scoreboard 2017 press conference, 10 April 2017; the video is available on the Commission’s audiovisual services portal (Reference: I-136896). Similarly, the data gaps have also triggered Parliamentarian Questions (PQs)88x The EP’s rules of procedure offer an oversight mechanism to monitor the activities of the EU executive branch; see Rules of Procedure of the European Parliament, Rules 128 (Questions for oral answer with debate), 130 (Questions for written answer). by members of the European Parliament on the Scoreboard and, particularly, the reasons behind the member states’ refusal to cooperate.89x PQs: E-004328-15, 17 March 2015 (about the lack of efficiency data from Belgium); E-004440-15, 18 March 2015 (missing data from Spain); E-003070-17, 2 May 2017 (about data gaps in general).
The Commission and the European Parliament encourage the member states to cooperate voluntarily and invest in better regulation systems, impact assessments and analytical and statistical capacity regarding the progress of judicial reforms and availability of court data.90x EU Justice Scoreboard 2015, 36. On a similar note, the EU Justice Commissioners have often expressed their commitment to ensuring better cooperation and initiating discussions with national authorities for all matters related to the development of the tool, its findings and the occurring data gaps.91x See above n. 87, at 16:28; see also Commission’s replies to PQs:, E-004328/2015, 5 June 2015 (referred to PQ E-004328-15); E-004440/2015, 19 June 2015 (referred to PQ E-004440-15); E-003070/2017, 18 July 2017 (referred to PQ E-003070-17).4.1.2 How Pervasive Are the Loopholes? The Case of Costs
As the previous subsection has explained, the voluntary participation of member states has significantly affected the completeness of the Scoreboard data collections. Member states do not always comply with the requests to provide judicial statistics with the same responsiveness.
But how pervasive are the data gaps for the Scoreboard in general and its statistics on costs in particular?
The problem of the missing data has been addressed in the 2015 edition with a specific indicator. It displayed the percentage of the information available per member state for each of the main fields measured on the Scoreboard, namely efficiency, quality and independence.92x EU Justice Scoreboard 2015, Fig. 56. The findings showed that data gaps were primarily localised in the area of efficiency of justice. Unfortunately, the same indicator has not been repeated in the following editions. Therefore, it is not always easy to assess the completeness of the Scoreboard database, nor can one quickly tell whether the Commission and EU Parliament’s persuasive powers in achieving cooperation have delivered in this regard.
Even more complex is to assess the effectiveness of the providers the Scoreboard uses in the field of costs. Whether those providers can match the expected results in terms of completeness of data is one of the main determinants of output quality. For instance, the non-availability of data from nearly all member states explained the lack of cost-relevant information of the first edition.93x EU Justice Scoreboard 2013, 20. However, with the gradual creation of synergies,94x See above Section 3.2. the DG Justice has expanded the cost-relevant data sets and presented findings from EU jurisdictions.
The mandates given to the different providers to collect data are not available to the public. Therefore, Scoreboard readers cannot assess the effectiveness of those providers in producing the expected results, as these had been specified in the mandates. Nevertheless, what can be assessed with quantifiable metrics is the final results delivered by the providers in terms of data completeness, as appeared in the Scoreboard.
The following chart shows the size of the available and missing data in the field of costs (Figure 7). For each cost-relevant indicator, the amount of data is calculated per variable and member state. If data availabilityData gaps in cost-relevant indicators (per year)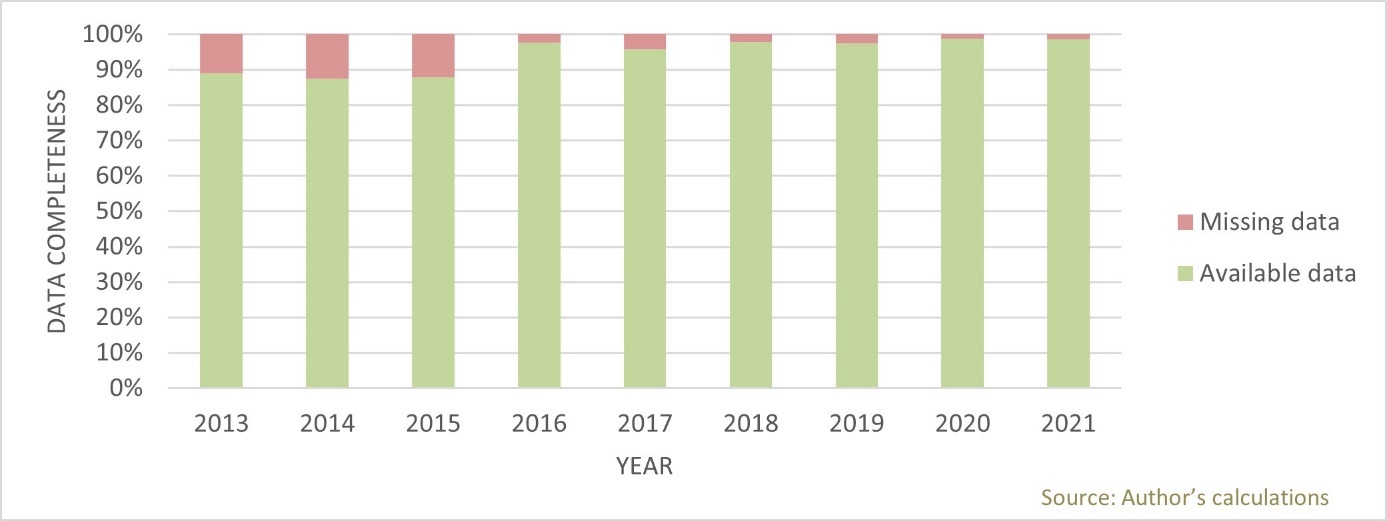
appears to be 100%, the providers have managed to deliver data from all member states in all variables included in the indicators. The amount of data is presented in an aggregated form for all cost-relevant indicators per year of publication.
Overall, the providers entrusted by the Commission have proven particularly effective from the very beginning in collecting data from all member states concerning all the information on costs that the Scoreboard considered. Therefore, data gaps, which significantly characterise the Scoreboard, in general, have not particularly affected the reporting on costs. Accumulated calculations from all Scoreboard editions show that the cost data sets are, on average, 96% complete.4.2 The Comparability and Quality of Data on Costs
However, completeness of data does not guarantee the quality of the data. A database with all its cells duly filled in may still report inaccurate or non-comparable information. The quality of the Scoreboard exercise shall therefore also be measured on its ability to convey information that is able to support policy considerations. Crucial in this regard is that data classified under the same heading from different member states actually reports the same information (comparability). This goal may be hard to achieve, as the following subsections will demonstrate. Problems may arise from different sources. The most obvious one is that the fact involving different providers (including member states) in a fact-finding exercise (4.2.1) may lead to inconsistencies as long as there is no common understanding of what information is to be collected (4.2.2). Besides this, homogeneous data may still convey uneven information if figures are not compared with the context they refer to. For instance, one euro does not have the same purchase power across the entire Eurozone, so that missing this information out may skew the reader’s perception of cross-country comparisons (4.2.3). Finally, even the most perfect statistical exercise may require some legal context to be able to deliver meaningful results because what functions courts actually perform may vary from country to country, often depending on legal traditions (4.2.4).
4.2.1 Collection Procedure and Comparability: Institutional Concerns
The second drawback that significantly affects the quality of the Scoreboard, next to completeness – is comparability. This is inherently related to the nature of the data presented. Only exceptionally does the Scoreboard include ‘primary data’. These are indicators that had been produced directly by the Commission with first-hand information, own surveys or interviews. Most of the Scoreboard indicators are based on ‘secondary data’ instead. These are information and judicial statistics kept by the national authorities and made available for the Commission. The data is communicated to DG Justice through various channels and intermediaries, such as CEPEJ, the ‘group of contact persons’ or European networks.
In this light, the availability and quality of the Scoreboard annual data largely depend on the collection methods at the domestic level. On the same note, national categories for which data is collected do not always correspond exactly to the ones used for the Scoreboard, and there are no common operational definitions across jurisdictions. Structural reforms, the re-organisation of the national judicial maps, and changes in the methodologies for collecting and categorising judicial statistics might also reduce the consistency of national data over time.
The Scoreboard indicators always have a backwards-looking nature, and findings refer to past evaluation cycles. Although the Commission tries to present timely and consistent data from the same period, the availability of such information depends on the logistics for its gathering. CEPEJ data usually refers to the second year before the year of each Scoreboard publication. When the Commission conducts its own surveys – for instance, through Eurobarometer – the answers are collected a few months before each publication and offer a more up-to-date picture. However, there are also cases where an indicator might display figures from different periods for the different member states95x E.g. EU Justice Scoreboard 2018, Fig. 26 (income threshold for legal aid): Data referred to 2017, Malta contributed with data from 2016; EU Justice Scoreboard 2019, Fig. 33 (share of female professional judges at 1st and 2nd instance courts): Data referred to 2017, Greece contributed with data from 2016; EU Justice Scoreboard 2021, Fig. 31 (general government total expenditure on law courts by category): Data referred to 2019, some Member States (France, Slovakia) used accumulated figures from previous evaluation periods. or provisional numbers and estimations.96x E.g., EU Justice Scoreboard 2020, Fig. 32-34; EU Justice Scoreboard 2021, Fig. 29-31.
Overall, despite the Commission’s determination to present homogeneous information on the performances of national courts in litigious civil, commercial and administrative cases, data inconsistencies for each evaluation period are eventually inevitable and significantly affect the end-product delivered each year.
The European Parliament voiced some concerns about the Scoreboard’s ability to provide an accurate picture of justice. It called the Commission to focus its attempts on gathering fewer but more reliable and comparable data.97x EP Resolution of 4 February 2014, OJ 2017 C 93/32; EP Resolution of 29 May 2018, OJ 2020 C 76/36. Similar calls also came by individual member states.98x Bundesrat, BR-Drucksache 92/15, para. 3. Nonetheless, the Commission appeared determined to continue exploring the possibility of expansion of the indicators in the future by using more sources, such as judicial networks and new expert groups.99x EU Justice Scoreboard 2015, 44.
The official answer to the EP’s critical calls came with a concise and diplomatic text.100x European Commission, SP(2014)414-0, 15 April 2014. The Commission acknowledged that the gathering of objective, comparable and reliable data remained the most significant challenge. However, it threw the ball into the member states court, declaring that it was the sole responsibility of national authorities to make this cooperation possible by providing timely and good-quality data. Similar replies were also given to the individual member states.101x E.g. European Commission, C(2015)5727 (reply to Bundesrat BR-Drucksache 92/15).4.2.2 Apples and Oranges? Structural Issues of Comparability
A closer look at the various Scoreboard editions can show how problems concerning the availability and the comparability of data have afflicted the DG Justice’s exercise from the beginning and are still a limitation today. Even when comparing aspects of national judicial systems that prima facie appear easier to assess with statistically quantifiable parameters alone – such as the financial resources for courts – the difficulties of cross-country comparisons represented the biggest challenge for different reasons.
For instance, the figures on public expenditure sent by the national authorities in preparation for the Scoreboard 2013 edition were not always separating between the different budgetary components. While some member states included the budget of prosecution services or legal aid,102x EU Justice Scoreboard 2013, Fig. 20. others did not. The same methodological problems that afflicted the 2013 edition were visible again in 2014. Data was either missing or not always consistent, and the member states often reported provisional figures.103x E.g. EU Justice Scoreboard 2014, n. 40-41.
These general concerns also involved some specific areas of justice costs and particularly those on legal aid. In the 2015 edition, for instance, the Commission made brief references to the caveats affecting the comparability of the data on that matter.104x EU Justice Scoreboard 2015, 31-2. The most pressing one was the lack of information on how the total public investments in legal aid were distributed among beneficiaries and per case. Overall, one should always bear in mind that the number of legal aid beneficiaries and the granted amount of legal aid are not always in a linear relationship. Some states have stricter eligibility conditions for legal aid but grant a high amount per case; others follow the opposite policy by loosening the conditions for legal aid admissibility but limiting the amount granted per case.105x See also CEPEJ, above n. 72, at 5. More limitations of the comparability of budgetary data on legal aid can be found by comparing the explanatory notes of each member state under Questions 12 and 12.1 of the CEPEJ Study. Therefore, the distribution of legal aid among beneficiaries and per case is critical when conducting cross-country comparisons.
The CCBE indicator on the income threshold for legal aid created in 2016 took into account the living and economic conditions in the member states.106x EU Justice Scoreboard 2016, Fig. 20. However, it left many questions unanswered in many editions, highlighting the transparency issues in the Commission’s approach when setting the Scoreboard’s benchmarks, selecting the data providers107x See also above 3.3. and collecting data. Apart from some generic statements on the objectives and methodology used, no further information is available on the selection of the sources or the complete data sets.
On top of this, the evolution of the Scoreboard variables on legal aid has sometimes been in the sense of aggregating data that were previously provided separately.108x See above n. 48. As a result of the data aggregation in the 2019 edition,109x EU Justice Scoreboard 2019, Fig. 21. for instance, disparities between legal aid eligibility for high- or low-value claims disappeared. Similarly, the aggregated figures did not always help understand whether the sudden fluctuations observed in some member states (compared with the previous edition)110x Ibid. (France, Latvia, and Slovenia); cf. EU Justice Scoreboard 2018, Fig. 26. were rooted in the developments of the domestic living and economic conditions, or were the results of the Commission’s changes in the methodology and presentation of the data, or, finally, were simply the result of inaccurate collection of data at the national level.
All in all, this makes the Scoreboard reader’s work occasionally difficult, especially when it comes to understanding national rules on legal aid. This is like trying to draw the function line that represents the legal aid structure, while the Scoreboard only provides one point within that line.
A similar problem also characterises the CCBE indicators on court charges in consumer disputes. Take the 2017 edition as an example.111x EU Justice Scoreboard 2017, Fig. 22. Court charges are displayed only as a share (in %) of the total value of the claim. Therefore, reverse engineering the Scoreboard findings to understand the underlying functions was not possible. This prevented tracking with sufficient confidence the original formula each member state adopted when defining court charges (flat tariffs, percentage tariffs, a combination of the two systems, tapering up to a certain amount, etc.). All in all, such shortcomings reduce the comparability of data. They prevent the reader from understanding, for instance, the extent to which similar results displayed for different states are showing an overlapping policy choice or are just a coincidental result, for the specific Scoreboard scenario, of rules that are otherwise different.4.2.3 Finding Uniform Measures for Non-uniform Countries: Size and Purchase Power
Next to the lack of homogeneity of national statistics and the formulas for calculating the figures for each jurisdiction, additional concerns surround the Scoreboard ability to provide a basis for cross-country comparisons in the realm of justice and adjudication costs in particular. These do not come from cases – such as those described in the previous subsection – where data under the same label report information referring to different phenomena. Rather, perfectly aligned information may convey a distorted image if the way it is conveyed does not take into account that the same data may mean different things depending on the context it refers to.
A typical issue stems from the different sizes of member states. Dividing the annual budget allocated to the judicial system by the country’s population can yield only a rough estimate of the sum invested in the operation of a domestic judicial system. Calculation methods per capita do not take into account economies of scale, which could also explain – at least to some extent – the results from the less-populated member states.112x E.g., Luxembourg is typically the top spender in the Scoreboard ranking on general government total expenditure on law courts since the first edition of 2013. Moreover, raw data in absolute amounts per capita should always be compared with the average domestic wealth, including per capita GDP. Yet the Scoreboard did not include such additional layers of analysis, and its input remained simplistic.
For all these reasons, the indicators on courts’ budgets can provide only a very rough overview of one isolated financial parameter related to the operation of domestic courts. Alone, it cannot support safer conclusions not only in a purely domestic setting but, even more, in a comparative cross-country context.
Once again, measuring legal aid shows problems that are similar to those concerning justice costs in general. The Commission first acknowledged these specific limitations in the 2016 edition of Scoreboard.113x EU Justice Scoreboard 2016, 19. It pointed out that the previous reporting methods based on the annual budgets allocated to legal aid114x E.g., EU Justice Scoreboard 2015, Fig. 39 (CEPEJ data). did not always enable safe cross-country comparisons. Additional parameters were needed to reflect the relevant macroeconomic conditions of each country and, more particularly, to allow the assessment of national legal aid schemes not abstractly but in the context of domestic income conditions.
The incorporation of domestic macroeconomic and living conditions was a necessary addition to the 2016 edition for assessing the effectiveness of domestic legal aid schemes. It expanded the available Scoreboard sources by involving lawyers and presenting more voices outside of the supply side of judicial services. By the same token, the direct liaison to the most prominent association of lawyers in the European continent was also a positive step. It opened up the Scoreboard analysis to a part of the demand side dealing professionally with judicial services. It remains to be seen whether the Commission intends to incorporate additional voices from the demand side, that is, the actual final users of courts such as businesses and citizens. This would balance out possible biases that vested interests may have in the collection of data in its current form.4.2.4 Finding Uniform Measures for Non-uniform Countries: Legal Contexts and Traditions
Finally, even the most perfect statistical exercise may require some legal context to deliver meaningful results. Institutions such as courts and legal tools such as court fees may work differently from country to country, often depending on legal traditions. The importance of legal context also explains the Commission’s reluctance to extract more generic comparative conclusions from the Scoreboard figures. This cautious approach reflects the inherent constraints on the use of quantitative data in the field of empirically based justice policies.
The complex relationship between the operation of courts, allocation of resources and economic efficiency is impossible to capture in its entirety solely with limited numerical data. Besides some basic needs common across jurisdictions, such as the costs for fixed assets or rental of buildings or infrastructure, the adequate distribution of financial and human resources depends largely on the multifaceted characteristics of each legal system. A more thorough analysis requires considering additional qualitative variables, which are anchored in the legal traditions of each system and diverge significantly across countries. Therefore, comparisons between countries should always be made cautiously and cannot be conducted without keeping an eye on the social, historical and domestic economic context, the structural peculiarities of each system and the different constitutional and legal traditions.
How the idiosyncrasies of legal systems can affect the comparability of data, particularly on budgets, can be illustrated with some examples. The Commission notes that even the broad distinction between inquisitorial and adversarial legal systems could significantly influence the amounts of public investments for the operation of courts.115x EU Justice Scoreboard 2013, 17. However, comparability questions arise even before considering the procedural principles defining the role and the function of a judge in a court. The Scoreboard does not always explain which adjudicative bodies are included in the displayed sums and which are not. Different forms of privatisation of dispute resolution have emerged in recent years in many EU countries.116x B. Hess, ‘Privatizing Dispute Resolution and Its Limits’, in L. Cadiet, B. Hess & M. Requejo Isidro (eds.), Privatizing Dispute Resolution: Trends and Limits (2019) 15. However, Nordic countries had established a tradition for decades in transferring litigious or non-litigious disputes to quasi-judicial bodies or public authorities that are state-funded and that operate similarly to courts.117x A. Nylund, ‘Rethinking Nordic Courts: An Introduction’, in L. Ervo, P. Letto-Vanamo & A. Nylund (eds.), Rethinking Nordic Courts (2021) 1, at 3. The scope of such bodies is broad and covers a variety of disputes related to consumers, personal injuries, family law and recourse against social benefits, to mention a few.118x A. Nylund, ‘Institutional Aspects of the Nordic Justice Systems: Striving for Consolidation and Settlements’, in L. Ervo, P. Letto-Vanamo & A. Nylund (eds.), Rethinking Nordic Courts (2021) 187, at 203-7. To what extent the Scoreboard figures on the expenditure and staff take such bodies into account is unclear. In any case, it affects cross-country comparisons on efficiency and resources.119x Nylund, above n. 10. Eurostat contains only a generic definition of law courts,120x According to Eurostat, the data includes ‘expenditure on administration, operation or support of civil and criminal law courts and the judicial system, including enforcement of fines and legal settlements imposed by the courts and operation of parole and probation systems; legal representation and advice on behalf of government or on behalf of others provided by government in cash or in services. Law courts include administrative tribunals, ombudsmen and the like, and exclude prison administrations’; See Eurostat data code: SDG_16_30, available at https://ec.europa.eu/eurostat/databrowser/view/sdg_16_30/default/table?lang=en (last visited 30 September 2021). which does not go deeper into the peculiarities of each legal system. CEPEJ, on the other hand, addresses some of these characteristics in the explanatory notes of each legal system. So, for instance, rent and tenancy tribunals or sections that operate as administrative agencies (e.g. in Sweden)121x CEPEJ, Study on the Functioning of Judicial Systems in the EU Member States – Facts and Figures from the CEPEJ Questionnaires 2010 to 2018 Part 2, CEPEJ(2019)17 rev4, at 686. or as a simplified electronic procedure for eviction cases (e.g. in Portugal)122x Ibid., at 556. are not always included in the CEPEJ data.
The Commission has consistently shown itself to be fully aware of these methodological limitations. As long as relevant variations existed at the national level regarding the costs of judicial services, additional reflections were needed on the collection, measurement and analysis of data to reduce divergences and achieve more homogeneous and comparative results. However, except for a few generic references in its pages,123x E.g., EU Justice Scoreboard 2013, 17. the Scoreboard did not delve into the problem with any specific methodological approach.
It is worth noting that the same concerns were also expressed by the European Parliament when it first assessed the Commission’s initiative.124x EP Resolution of 4 February 2014, OJ 2017 C 93/32. Although the EP was formulating its critique diplomatically, a clear message was sent to the Commission regarding the Scoreboard methodology and output. Statistical assessments of judicial systems should respect the legal and constitutional traditions of member states. They should be based on objective criteria, on reliable and comparable data. With these thoughts, the EP indirectly questioned the Commission’s one-size-fits-all approach to setting the Scoreboard’s benchmarks and collecting data. The concept of justice and its agents (courts) as a complex, multidimensional social and political phenomenon required a more sophisticated assessment. In this respect, the EP has directly called the Commission to enhance the Scoreboard methodology by taking into greater consideration the differences between national judicial systems in the future.125x Ibid., para. 8.
The concerns of the EP about the tool’s blueprint and the Commission’s overall attitude were not tackled directly in the Scoreboard. The 2014 edition contained some generic references to the need to account for the different legal traditions and the broader need for improvements of the indicators. However, those statements lacked the emphasis one would have expected in light of the EP’s auspices, nor did they include concrete suggestions.126x EU Justice Scoreboard 2014, 3, 27. The same shortcomings affect, to some extent, all the following editions. The EP’s main criticism against the one-size-fits-all Scoreboard methodology had been answered only with a short reference to the equality of treatment between member states.127x See above n. 100.
The area where these contradictions emerge most clearly is undoubtedly that of judicial reforms, including the reforms involving the costs of access to justice. As mentioned before,128x See Section 2.2. the 2015 Scoreboard introduced a new indicator on the scope, scale and state of play of judicial reforms across the EU.
Unfortunately, the indicator offered information only on the mere existence of domestic legislative initiatives, entirely neglecting the importance of contextualisation and bearing no explanations on the surrounding circumstances under which judicial reforms had taken place. By the same token, the Scoreboard explanatory comments did not include descriptions or qualitative analysis of the concrete measures discussed or adopted in each jurisdiction.129x Bundesrat; BR-Drucksache 173/16, para. 3. Readers interested in finding out more about the reforms’ content and impact on citizens and society had to look for material outside the pages of the Scoreboard.
Thus, only by relying on other sources could readers gain a more precise understanding of the supply policies being followed in the area of justice in the aftermath of the sovereign-debt crisis. So, for instance, studies conducted in the same period by the Committee of the European Parliament for Civil Liberties, Justice and Home Affairs (LIBE) on the impact of the crisis on fundamental rights were revealing.130x A.I. Tamamović, The Impact of the Crisis on Fundamental Rights across Member States of the EU: Comparative Analysis, European Parliament, PE 510.021 (2015); the selected states were Belgium, Cyprus, Greece, Ireland, Italy, Spain and Portugal. The comparative report gave eye-opening information on the consequences of austerity measures that had addressed the costs of judicial services directly or indirectly:131x Ibid., at 95-109. court fees have been instated for proceedings that used to be traditionally free;132x For England: J. Sorabji, ‘Austerity’s Effect on English Civil Justice’, 8 Erasmus Law Review 159 (2015); Spain: L. Carballo Piñeiro and J. Nieva Fenoll, ‘The Impact of the Economic Downturn in the Spanish Civil Justice System’, 8 Erasmus Law Review 174, at 178 (2015). court charges have skyrocketed, in some cases up to 750% (e.g. Greece);133x Tamamović, above n. 130, at 101. legal aid budgets had shrunk,134x See also X. Kramer and S. Kakiuchi, ‘Austerity in Civil Procedure and the Role of Simplified Procedures’, 8 Erasmus Law Review 139, at 143 (2015). new taxation regulations imposed VAT on lawyers’ fees (e.g. in Belgium and Greece).135x Tamamović, above n. 130, at 101. For the same reasons, several of the court fees reforms had been declared unconstitutional, constituting, according to national courts, a disproportionate obstacle to access to justice.136x See e.g., the Spanish Constitutional Court decision 140/2016 of 21 July 2016 (published in the Spanish Official Bulletin on 1 August 2016 declaring the Law 10/2012 of 20 November 2012, regulating certain fees relating to the administration of justice, unconstitutional), Press Release of the Tribunal No 74/2016, 29 July 2016. Again, the Justice Scoreboard failed to provide such additional and crucial data on the content and the impact of reforms. Instead, by keeping its quantity-over-quality approach, it could ultimately provide only an over-simplistic overview of domestic reforms initiatives in the policy area of justice.
Once again, legal aid can further illustrate the point. The indicator first developed in 2016 to measure access to legal aid,137x EU Justice Scoreboard 2016, Fig. 20. despite its apparent simplicity, fell short of providing a sufficiently detailed indication as to the conditions to have access to that form of financial support. To understand those conditions properly, readers should always read the indicator together with the accompanying explanatory comments and footnotes, and even in this case the picture would only be partial. Despite the Commission’s attempts to provide more comprehensive information, comparisons across jurisdictions should still be made with caution, given the complexity of domestic legal aid schemes.
As with all quantitative data on legal aid, those figures should be read carefully as they do not always include the entirety of the available eligibility criteria of each system. Next to the income thresholds, other factual parameters may often lead to automatic granting of legal aid, such as the qualification of applicants (particularly for recipients of social benefits other than legal aid alone) or the merits of the case. The existence of requirements that identify ipso jure the beneficiaries of legal aid (e.g., unemployment, incapacity for work, or social benefits receivers), the variety of the eligibility criteria (including financial or non-financial capital thresholds), the different reference periods applied (e.g. monthly or annual income of the applicant), or even the merits of the case are all additional and important parameters that were difficult to capture and reflect in the numerical data of the indicator, as also recognised by the Commission itself.138x Idem. Using a homogeneous definition of legal aid for all national systems excluded de facto public resources allocated, e.g. on advisory services for pre-proceedings, and raised protests by some member states, which questioned the accuracy of the data.139x E.g. Bundesrat, BR-Drucksache 173/16, para. 2.
Perhaps mindful of these limitations, the Scoreboard – and, more generally, the Commission – refrained from recommending one-size-fits-all solutions to enhance the effectiveness of national courts based, for instance, on optimal allocation of financial and human resources. Each member state should ascertain the appropriate distribution of resources across jurisdictions after a holistic and in-depth assessment of the domestic conditions.4.3 Cost Data in Context
Section 4.2 has shown that, on top of the limitation surrounding data availability analysed in Section 4.1, one should not forget that the completeness of data does not guarantee the quality of data. The problems of comparability and reliability remain and are not necessarily connected with the sources’ commitment to fulfilling their mandates. They are instead related to the inherent constraints on comparative empirical legal research.
The heterogeneity of national judicial statistics significantly affects the comparability of the Scoreboard data. Moreover, it is highly questionable whether the use of quantitative data alone can support safe conclusions without the additional consideration of the different legal traditions and the multifaceted characteristics of each legal system. The challenge of quantification becomes even greater when mapping legal aid or litigants’ fees with numbers. The perplexity of national legal aid schemes, the function and calculation formulas of court charges across jurisdictions, and the diverse regulatory approaches in setting the market prices for legal services need to be taken into account when comparing data on costs.
Caveats and limitations in data collection are often listed in the Scoreboard explanatory notes and footnotes. However, more transparency in the data collection processes could have enabled a more thorough evaluation of the reliability and comparability of the data. Unfortunately, neither the complete data sets nor the methodology used to construct indicators is always available to the public.
However, as Sections 4.1 and 4.2 have demonstrated, a better look at the Scoreboard’s pages reveals frequent data inconsistencies, such as figures from different years, provisional numbers or even estimations by the member states.140x E.g., EU Justice Scoreboard 2020, Fig. 32-34; EU Justice Scoreboard 2021, Fig. 29-31. On a similar note, data on legal aid or fees is equally dependent on the peculiarities of each legal system.141x E.g., EU Justice Scoreboard 2021, Fig. 23-24 (explanatory notes). Considering these limitations, the Scoreboard data collections on costs may offer readers a first orientation. However, they should be used very cautiously when carrying out scholarly analysis or policymaking. -
5 The Costs of Accessing Justice: A Double-Edged Sword
Among the policymaking areas that are most sensitive to the data-driven analysis of the Scoreboard are, without a doubt, court fees. The way data is presented and collected and the drawbacks this project displays are therefore important in order to understand what kind of impact the Scoreboard can have on such policy. In other words, data may be objective but hardly neutral, the difference being in the selection of the information to cover and on the way such information is conveyed. In this part, the article addresses these implications with specific regard to the Scoreboard approach to the impact of court fees on efficiency and rule-of-law protection.
Costs and their effect on access to justice may also be in a complex relationship with rule-of-law protection.142x Dori, above n. 7. Unfortunately, the relationship between costs, on the one hand, and the rule of law or efficiency, on the other, is not linear. An increase in the costs of adjudication could reduce access to justice. However, it is also likely to facilitate case management and reduce caseload, which is translated into quicker decisions, which in turn are beneficial to the rule of law. Whether a judicial system is more efficient when it delivers fewer decisions in a relatively shorter time or when it can handle a larger caseload in a lengthier fashion depends, of course, on the preferences of citizens and policymakers, including on distributive concerns. Which policy choice prevails is, to a large extent, a matter of value judgment.
Here, an example is given of how the Scoreboard deals with this sensitive issue. A potential dissuasive effect of high costs of proceedings does not appear to raise concerns for the Commission, at least not as long as high costs lead to a drastic reduction of incoming or pending litigious cases. Spain offered a good example of such relativisation of the Scoreboard findings in the 2016 edition.
In that edition, the Scoreboard failed once again to offer an account of the surrounding economic and social context where national trends were occurring. A focus on the member states that showed remarkable improvements in their results143x The 2016 Scoreboard emphasised the positive developments in many member states, which faced particular challenges and numerous incoming and pending cases in the past; see EU Justice Scoreboard 2016, 16. would quickly show a more complex reality than the Scoreboard would tell. As mentioned only in a footnote and in small letters, the drastic drop in the number of incoming cases in Spain was attributed (next to methodological changes in the collection of national data) also to ‘the introduction of court fees for natural persons’.144x Ibid, notes under Fig. 3 for Spain. Indeed, a strong correlation existed between the Scoreboard findings for Spain and the stipulation of court charges, as statistics showed a reduction in the number of incoming cases in almost all Spanish courts affected by Spain’s new measures on court fees.145x J. Lladós Vila and T. Freixes, ‘The Impact of the Crisis on Fundamental Rights across Member States of the EU – Country Report for Spain’, European Parliament, PE 510.019, at 65 (2015). What the Commission had considered in passim and with an asterisk as a standardised policy lever to adjust the volume of filed and pending actions within a system constituted one of the most controversial justice reforms of the past decades in Spain. The measures met with considerable opposition within the Spanish society as a symptom of unequal access to justice. They were widely denounced by the legal community, consumer associations, the Spanish Ombudsperson and lower courts’ rulings owing to their lack of proportionality between the court charges and the average purchasing power of citizens.146x Ibid., at 62-8. Ultimately, they were declared unconstitutional in 2016.147x Spanish Constitutional Court, above n. 136. Considering, however, the Commission’s tendency to assess positively any decline in the figures of incoming cases,148x EU Justice Scoreboard 2016, 16. the dissuasive effects on people to access justice caused by disproportional court charges was rather seen as a success story and a legitimate practice. -
6 Conclusions
The EU Justice Scoreboard is the first attempt of the European Commission to venture into the field of evidence-based justice policies. It provides data on the functioning of national justice systems in the three main fields of efficiency, quality and independence and is based on the voluntary participation of EU member states.
The Commission’s starting point is straightforward. The different national legal traditions and the peculiarities of each legal order should not affect the common objective of the European AFSJ. Affordable and timely judicial proceedings by independent courts are essential for the rule-of-law protection and strengthening of the internal market.
The article focused on one of the most significant parts of the Scoreboard, namely the one dedicated to costs for the supply and demand sides of judicial services. The Scoreboard considers costly (and lengthy) judicial proceedings as the main obstacle(s) to access to justice. By creating synergies with various data providers, the Scoreboard developed a data set progressively on the affordability of national justice systems.
Contrary to the Commission’s starting point, however, the idiosyncrasies of the national systems and the heterogeneity of national judicial statistics do affect how individual characteristics should be measured and compared across jurisdictions. A closer look at the Scoreboard shows that even aspects of courts’ functioning, which by definition appear easier to quantify, such as the costs of adjudication, cannot be easily assessed alone with quantifiable metrics and without contextualisation. And while it is true that the Scoreboard data sets on costs are complete and do not appear to be affected by data gaps, the Commission’s one-size-fits-all approach in this regard often leads to questionable results.
Scoring exercises often lead to this kind of consequence, if only because comparability requires to fit national rules and implementations within a common evaluation grid.149x Unsurprisingly, similar problems affect another important exercise as the World Bank’s Doing Business Report: see e.g. L. Enriques and M. Gargantini, ‘Form and Function in Doing Business Rankings: Is Investor Protection in Italy Still So Bad?’, 1 University of Bologna Law Review 1 (2016). In this regard, different results displayed by member states may be misleading to the extent that such an evaluation grid does not adapt to all of them. Fitting different national systems into a single set of metrics does not lead to theoretical problems alone. Another more practical consequence is that data is sometimes inconsistent, often based on estimations and does not use common operational definitions. Crucial information on the peculiarities of each system, if revealed, is squeezed in asterisks and footnotes.
Additionally, the Scoreboard does not delve directly into the uneasy relationship between the rule of law, efficiency of courts and costs. On the sensitive issue of using litigation tariffs to adjust the volume of litigation, it only offers some sporadic hints. The Commission complements those member states, which faced particular challenges and improved their performances by decreasing incoming and pending cases. At the same time, however, it does not offer a contextualisation of the measures taken to achieve improvements. The example of Spain in the 2016 edition with the dissuasive effect of high costs of proceedings on the volume of litigation shows that the Commission seems to favour efficiency, although somewhat misguided.
On top of that, the Commission has not always been particularly transparent regarding the creation and development of the Scoreboard. This general feeling of unaccountability affects more than one step in the procedure. It starts with the selection of the data providers that feed the tool among the available alternatives, but it is also reflected in the concepts underpinning the features of the indicators used. On a similar note, not all data providers made their complete data sets available to the public. The indicators’ objectives and methodology are addressed in the Scoreboard pages. General statements are repeated in identical text in all editions.
Consequently, readers are rarely offered the possibility of better understanding the indicators’ selection and production process. In most cases, they are left with figures and charts alone. It is unclear to what extent the DG Justice follows the old saying attributed to Otto von Bismarck on lawmaking and treats the Scoreboard data sets as sausages.150x It was Bismarck who said that the man who wishes to keep his respect for sausages and laws should not see how either is made. However, as the Scoreboard is often used as a starting point of academic analyses on the performance of justice and policy proposals by regulators and lawmakers, closer ex post facto scrutiny seems necessary to make sure those analyses and those proposals are based on solid ground. Moreover, the use of sound, independent and scientific concepts developed in a dialogue with the academic community and policymakers could benefit the Scoreboard methodology and framing of indicators. -
1 European Commission, ‘2020 Rule of Law Report, COM(2020)580 final, 8.
-
2 European Commission, ‘The EU Justice Agenda for 2020 – Strengthening Trust, Mobility and Growth within the Union’, COM(2014)144 final.
-
3 EU Justice Scoreboard 2021, 1.
-
4 All editions are available at https://ec.europa.eu/info/policies/justice-and-fundamental-rights/upholding-rule-law/eu-justice-scoreboard_en (last visited 30 September 2021).
-
5 EU Justice Scoreboard 2013, 3.
-
6 CEPEJ Guidelines on Judicial Statistics (GOJUST) adopted by the CEPEJ at its 12th plenary meeting (Strasbourg, 10-11 December 2008), CEPEJ(2008)11.
-
7 See also A. Dori, ‘The Supply and Demand of Justice: What Policy Implications from the EU Justice Scoreboard?’, III Yearbook of Socio-Economic Constitutions (2022) (forthcoming); A. Ontanu, M. Velicogna & F. Contini, ‘How Many Cases: Assessing the Comparability of EU Judicial Datasets’, 8 Comparative Law Review 1 (2017).
-
8 CEPEJ, Checklist for promoting the quality of justice and the courts adopted by the CEPEJ at its 11th plenary meeting (Strasbourg, 2-3 July 2008); see also Opinion No 6 (2004) Consultative Council of European Judges (CCJE) on fair trial within a reasonable time and a judge’s role in trials taking into account alternative means of dispute settlement and Opinion No 11 (2008) on the quality of judicial decisions.
-
9 Council of Europe, Judges: independence, efficiency and responsibility of judges, Recommendation CM/Rec(2010)12 and explanatory memorandum.
-
10 For the problems with the Scoreboard data collections see: R. Mohr and F. Contini, ‘Conflict and Commonalities in Judicial Evaluation’, 4 Oñati Socio-Legal Series 843 (2014); Dori, above n. 7; Ontanu, Velicogna & Contini, above n. 7; M. Fabri, ‘Methodological Issues in the Comparative Analysis of the Number of Judges, Administrative Personnel, and Court Performance Collected by The Commission for the Efficiency of Justice of the Council Of Europe’, 7 Oñati Socio-Legal Series 616 (2017); Ibid., ‘Comparing the Number of Judges and Court Staff across European Countries’, 26 International Journal of the Legal Profession 5 (2019); A. Nylund, ‘Comparing the Efficiency and Quality of Civil Justice in Scandinavia: The Role of Structural Differences and Definitions of Quality’, 38 Civil Justice Quarterly 427 (2019), A. Ontanu and M. Velicogna, ‘The Challenge of Comparing EU Member States Judicial Data’, 11 Oñati Socio-Legal Series 446 (2021). For more generic literature dedicated to the Scoreboard see: E. Van Rijckevorsel, ‘The European Union and the “Indirect Promotion of Its Values”: An Analysis of the Justice Scoreboard and the Roma Framework’, 3 Journal européen des droits de l’homme 444 (2016); A. Strelkov, ‘EU Justice Scoreboard: A New Policy Tool For “Deepening” European Integration?’, 27 Journal of Contemporary European Studies 15 (2019); B. Cappellina, ‘Legitimising EU Governance through Performance Assessment Instruments – European Indicators for a Judicial Administration Policy’, 2 International Review of Public Policy 141 (2020).
-
11 EU Justice Scoreboard 2013, 20.
-
12 Ibid., at 17.
-
13 CEPEJ differentiates between ‘budget approved’, which has been formally authorised by law (by the Parliament or another competent public authority), and ‘budget implemented’, which covers expenditure actually incurred in the reference year; see CEPEJ Glossary, CEPEJ(2020)Rev1.
-
14 EU Justice Scoreboard 2013, Fig. 20.
-
15 EU Justice Scoreboard 2014, 4.
-
16 Ibid., at 7.
-
17 Ibid., Fig. 25-26.
-
18 Ibid., at 27.
-
19 European Commission, ‘Europe 2020, A Strategy for Smart, Sustainable and Inclusive Growth’, COM (2010) 2020 final; For the cryptic notion of ‘structural reforms’; see A. Crespy and P. Vanheuverzwijn, ‘What “Brussels” Means by Structural Reforms: Empty Signifier or Constructive Ambiguity?’, 17 Comparative European Politics 92 (2019).
-
20 EU Justice Scoreboard 2015, 4; European Commission, ‘Communication from the Commission, Annual Growth Survey 2015’, COM(2014)902 final; see also B. Hess and G. Dimitropoulos, ‘Judicial Reforms in Luxembourg and Europe: International and Comparative Perspectives’, in B. Hess (ed.), Judicial Reforms in Luxemburg and Europe (2014) 11, at 18.
-
21 In this respect scholars have pointed out in the broader EU economic governance the paradoxical challenge of ‘doing better with less’ or, in other words, providing high-quality services in times of budgetary austerity; see R. Peña-Casas, S. Sabato, V. Lisi & C. Agostini, ‘The European Semester and Modernisation of Public Administration’, European Social Observatory 5-6 (December 2015).
-
22 EU Justice Scoreboard 2015, Fig. 1.
-
23 Ibid., Fig. 38-41.
-
24 See Section 4.2.
-
25 EU Justice Scoreboard 2015, 36.
-
26 Ibid., at 38.
-
27 Ibid., Fig. 50.
-
28 Ibid., at 32, 36.
-
29 Ibid., at 32 and Fig. 39.
-
30 Ibid., Fig. 26.
-
31 Ibid., at 36.
-
32 Ibid., Fig. 34.
-
33 Ibid., Fig. 29.
-
34 EU Justice Scoreboard 2016, Fig. 50-51.
-
35 The incorporation of domestic living and economic conditions when assessing national legal aid schemes has also been highlighted by the German Bundesrat, BR-Drucksache 92/15, para.6.
-
36 More on the Scoreboard data providers in Section 3.
-
37 EU Justice Scoreboard 2016, Fig. 20.
-
38 EU Justice Scoreboard 2017, Fig. 32-34.
-
39 EU Justice Scoreboard 2016, Fig. 31-32.
-
40 EU Justice Scoreboard 2017, Fig. 47-49.
-
41 ‘Time limits’ are understood as quantitative deadlines for courts; ibid., at 32.
-
42 ‘Time frames’ are understood as measurable targets and practices, e.g. specifying a predefined share of cases to be completed within a certain time; idem.
-
43 ‘Backlogs’ are understood as the number of pending cases after a certain predefined amount of time; idem.
-
44 Ibid., Fig. 21.
-
45 Ibid., Fig. 22.
-
46 EU Justice Scoreboard 2018, Fig. 25.
-
47 EU Justice Scoreboard 2019, Fig. 31.
-
48 Ibid., Fig. 21.
-
49 EU Justice Scoreboard 2020, Fig. 32-34.
-
50 Ibid., Fig. 23-24.
-
51 Ibid., at 28.
-
52 In some states the recovery of court fees is decided on a case-by-case basis, e.g. Portugal and Romania; others do not foresee the full recovery of court fees, e.g. Greece and Hungary; ibid., 24.
-
53 Ibid., Fig. 25.
-
54 Ibid., Fig. 26.
-
55 Revocability of legal costs occurred during the pre-litigious phase is not foreseen in all member states, and those costs were consequently not included; ibid., at 29.
-
56 European Commission, ‘Digitalisation of Justice in the European Union: A Toolbox of Opportunities’ COM(2020)710 and accompanying SWD(2020)540.
-
57 See EU Justice Scoreboard 2021, 5 and Fig. 39-47; See also A. Biard, J. Hoevenaars, X. Kramer & E. Themeli, ‘Introduction: The Future of Access to Justice – Beyond Science Fiction’, in X. Kramer, A. Biard, J. Hoevenaars & E. Themeli (eds.), New Pathways to Civil Justice (2021) 1, at 15-16.
-
58 EU Justice Scoreboard 2021, Fig. 44.
-
59 Ibid., Fig. 27.
-
60 Ibid., Fig. 44.
-
61 World Bank’s Doing Business Report (DBR) or the Global Competitiveness Report (GCR) of the World Economic Forum.
-
62 CEPEJ was established in 2002 to promote with various activities (e.g. reports, guidelines, recommendations) the exchange of best practices and the creation of a common legal culture among CoE member states; see Resolution Res(2002) 12 of the Committee of Ministers, Appendix 1, Statute of the European Commission for the Efficiency of Justice (CEPEJ), Arts. 1-3.
-
63 CEPEJ, 18th plenary meeting (7-8 December 2011), Abridged Report.
-
64 For the uneasy cooperation between CEPEJ and the DG Justice, see M. Velicogna, ‘The EU Justice Scoreboard and the Challenge of Investigating the Functioning of EU Justice Systems and Their Impact on the Economy of the Member States’, Paper prepared for the ‘Società Italiana di Scienza Politica’ (SISP) Conference (September 2013).
-
65 For the increasing role of EU judicial networks on EU justice policymaking, see S. Benvenuti, ‘National Supreme Courts and the EU Legal Order: Building a European Judicial Community through Networking’, 6 Perspectives on Federalism 1 (2014); M. Claes and M. Visser, ‘Are You Networked Yet? On Dialogues in European Judicial Networks’, 8 Utrecht Law Review 100 (2012); D. Piana, Judicial Accountabilities in New Europe: From Rule of Law to Quality of Justice (2010), at 37-8.
-
66 More at www.ccbe.eu/ (last visited 30 September 2021).
-
67 See also below Section 3.2.
-
68 EU Justice Scoreboard 2015, 4.
-
69 Information available at the Register of Commission’s Expert Groups and Other Entities at https://ec.europa.eu/transparency/regexpert/index.cfm?do=groupDetail.groupDetail&groupID=3022 (last visited 30 September 2021).
-
70 Eurobarometer was created in 1974 to boost the European Union’s political project; see S. Signorelli, ‘The EU and Public Opinions: A Love-Hate Relationship?’, 93 Notre Europe Studies & Reports (2012), at 12; S. Nissen, ‘The Eurobarometer and the Process of European Integration’, 48 Quality & Quantity 713 (2014).
-
71 E.g., the ‘Expert Group on Money Laundering and Terrorist Financing’ or the ‘Communications Committee’ (COCOM).
-
72 CEPEJ, Study on the Functioning of Judicial Systems in the EU Member States – Facts and Figures from the CEPEJ Questionnaires 2010 to 2018, Part 1, CEPEJ(2019)17 rev4.
-
73 More on that in Section 4.1.1.
-
74 Available at www.coe.int/en/web/cepej/cepej-work/evaluation-of-judicial-systems (last visited 30 September 2021).
-
75 EU Justice Scoreboard 2013, 20.
-
76 See above Section 2.2.
-
77 For the problems of the Scoreboard data collections see the literature references above n. 10.
-
78 EU Justice Scoreboard 2013, 20; EU Justice Scoreboard 2021, 3.
-
79 Idem.
-
80 N. Nielsen, ‘EU Justice Scoreboard Upsets Some Member States’, EUobserver, 14 March 2014.
-
81 B. Cappellina, Quand la Gestion S’Empare de la Justice: De la Fabrique Européenne aux Tribunaux (2018), at 241.
-
82 Council of the European Union, 3279th Council Meeting – Justice and Home Affairs, Brussels, 5-6 December 2013, Press Release 17342/13, 18.
-
83 E.g., EU Justice Scoreboard 2019, Fig. 55-57 (structural independence arrangements for prosecution services).
-
84 See, e.g., Parliament of the United Kingdom, House of Commons European Scrutiny Committee, 47th Report of Session 2013-2014, 15 May 2014, 25 MOJ (35888) (34822).
-
85 From the first Scoreboard edition the German Bundesrat (i.e. legislative body that represents the sixteen federated states of Germany) issued Opinions (Stellungnahmen) commenting on the Commission’s initiative: see BR-Drucksache 244/13, 171/14, 92/15, 173/16, 279/17, 416/18, 294/19, 526/20.
-
86 E.g., EU Justice Scoreboard 2016 press conference, 11 April 2016; the video is available on the Commission’s audiovisual services portal (Reference: I-119359).
-
87 EU Justice Scoreboard 2017 press conference, 10 April 2017; the video is available on the Commission’s audiovisual services portal (Reference: I-136896).
-
88 The EP’s rules of procedure offer an oversight mechanism to monitor the activities of the EU executive branch; see Rules of Procedure of the European Parliament, Rules 128 (Questions for oral answer with debate), 130 (Questions for written answer).
-
89 PQs: E-004328-15, 17 March 2015 (about the lack of efficiency data from Belgium); E-004440-15, 18 March 2015 (missing data from Spain); E-003070-17, 2 May 2017 (about data gaps in general).
-
90 EU Justice Scoreboard 2015, 36.
-
91 See above n. 87, at 16:28; see also Commission’s replies to PQs:, E-004328/2015, 5 June 2015 (referred to PQ E-004328-15); E-004440/2015, 19 June 2015 (referred to PQ E-004440-15); E-003070/2017, 18 July 2017 (referred to PQ E-003070-17).
-
92 EU Justice Scoreboard 2015, Fig. 56.
-
93 EU Justice Scoreboard 2013, 20.
-
94 See above Section 3.2.
-
95 E.g. EU Justice Scoreboard 2018, Fig. 26 (income threshold for legal aid): Data referred to 2017, Malta contributed with data from 2016; EU Justice Scoreboard 2019, Fig. 33 (share of female professional judges at 1st and 2nd instance courts): Data referred to 2017, Greece contributed with data from 2016; EU Justice Scoreboard 2021, Fig. 31 (general government total expenditure on law courts by category): Data referred to 2019, some Member States (France, Slovakia) used accumulated figures from previous evaluation periods.
-
96 E.g., EU Justice Scoreboard 2020, Fig. 32-34; EU Justice Scoreboard 2021, Fig. 29-31.
-
97 EP Resolution of 4 February 2014, OJ 2017 C 93/32; EP Resolution of 29 May 2018, OJ 2020 C 76/36.
-
98 Bundesrat, BR-Drucksache 92/15, para. 3.
-
99 EU Justice Scoreboard 2015, 44.
-
100 European Commission, SP(2014)414-0, 15 April 2014.
-
101 E.g. European Commission, C(2015)5727 (reply to Bundesrat BR-Drucksache 92/15).
-
102 EU Justice Scoreboard 2013, Fig. 20.
-
103 E.g. EU Justice Scoreboard 2014, n. 40-41.
-
104 EU Justice Scoreboard 2015, 31-2.
-
105 See also CEPEJ, above n. 72, at 5. More limitations of the comparability of budgetary data on legal aid can be found by comparing the explanatory notes of each member state under Questions 12 and 12.1 of the CEPEJ Study.
-
106 EU Justice Scoreboard 2016, Fig. 20.
-
107 See also above 3.3.
-
108 See above n. 48.
-
109 EU Justice Scoreboard 2019, Fig. 21.
-
110 Ibid. (France, Latvia, and Slovenia); cf. EU Justice Scoreboard 2018, Fig. 26.
-
111 EU Justice Scoreboard 2017, Fig. 22.
-
112 E.g., Luxembourg is typically the top spender in the Scoreboard ranking on general government total expenditure on law courts since the first edition of 2013.
-
113 EU Justice Scoreboard 2016, 19.
-
114 E.g., EU Justice Scoreboard 2015, Fig. 39 (CEPEJ data).
-
115 EU Justice Scoreboard 2013, 17.
-
116 B. Hess, ‘Privatizing Dispute Resolution and Its Limits’, in L. Cadiet, B. Hess & M. Requejo Isidro (eds.), Privatizing Dispute Resolution: Trends and Limits (2019) 15.
-
117 A. Nylund, ‘Rethinking Nordic Courts: An Introduction’, in L. Ervo, P. Letto-Vanamo & A. Nylund (eds.), Rethinking Nordic Courts (2021) 1, at 3.
-
118 A. Nylund, ‘Institutional Aspects of the Nordic Justice Systems: Striving for Consolidation and Settlements’, in L. Ervo, P. Letto-Vanamo & A. Nylund (eds.), Rethinking Nordic Courts (2021) 187, at 203-7.
-
119 Nylund, above n. 10.
-
120 According to Eurostat, the data includes ‘expenditure on administration, operation or support of civil and criminal law courts and the judicial system, including enforcement of fines and legal settlements imposed by the courts and operation of parole and probation systems; legal representation and advice on behalf of government or on behalf of others provided by government in cash or in services. Law courts include administrative tribunals, ombudsmen and the like, and exclude prison administrations’; See Eurostat data code: SDG_16_30, available at https://ec.europa.eu/eurostat/databrowser/view/sdg_16_30/default/table?lang=en (last visited 30 September 2021).
-
121 CEPEJ, Study on the Functioning of Judicial Systems in the EU Member States – Facts and Figures from the CEPEJ Questionnaires 2010 to 2018 Part 2, CEPEJ(2019)17 rev4, at 686.
-
122 Ibid., at 556.
-
123 E.g., EU Justice Scoreboard 2013, 17.
-
124 EP Resolution of 4 February 2014, OJ 2017 C 93/32.
-
125 Ibid., para. 8.
-
126 EU Justice Scoreboard 2014, 3, 27.
-
127 See above n. 100.
-
128 See Section 2.2.
-
129 Bundesrat; BR-Drucksache 173/16, para. 3.
-
130 A.I. Tamamović, The Impact of the Crisis on Fundamental Rights across Member States of the EU: Comparative Analysis, European Parliament, PE 510.021 (2015); the selected states were Belgium, Cyprus, Greece, Ireland, Italy, Spain and Portugal.
-
131 Ibid., at 95-109.
-
132 For England: J. Sorabji, ‘Austerity’s Effect on English Civil Justice’, 8 Erasmus Law Review 159 (2015); Spain: L. Carballo Piñeiro and J. Nieva Fenoll, ‘The Impact of the Economic Downturn in the Spanish Civil Justice System’, 8 Erasmus Law Review 174, at 178 (2015).
-
133 Tamamović, above n. 130, at 101.
-
134 See also X. Kramer and S. Kakiuchi, ‘Austerity in Civil Procedure and the Role of Simplified Procedures’, 8 Erasmus Law Review 139, at 143 (2015).
-
135 Tamamović, above n. 130, at 101.
-
136 See e.g., the Spanish Constitutional Court decision 140/2016 of 21 July 2016 (published in the Spanish Official Bulletin on 1 August 2016 declaring the Law 10/2012 of 20 November 2012, regulating certain fees relating to the administration of justice, unconstitutional), Press Release of the Tribunal No 74/2016, 29 July 2016.
-
137 EU Justice Scoreboard 2016, Fig. 20.
-
138 Idem.
-
139 E.g. Bundesrat, BR-Drucksache 173/16, para. 2.
-
140 E.g., EU Justice Scoreboard 2020, Fig. 32-34; EU Justice Scoreboard 2021, Fig. 29-31.
-
141 E.g., EU Justice Scoreboard 2021, Fig. 23-24 (explanatory notes).
-
142 Dori, above n. 7.
-
143 The 2016 Scoreboard emphasised the positive developments in many member states, which faced particular challenges and numerous incoming and pending cases in the past; see EU Justice Scoreboard 2016, 16.
-
144 Ibid, notes under Fig. 3 for Spain.
-
145 J. Lladós Vila and T. Freixes, ‘The Impact of the Crisis on Fundamental Rights across Member States of the EU – Country Report for Spain’, European Parliament, PE 510.019, at 65 (2015).
-
146 Ibid., at 62-8.
-
147 Spanish Constitutional Court, above n. 136.
-
148 EU Justice Scoreboard 2016, 16.
-
149 Unsurprisingly, similar problems affect another important exercise as the World Bank’s Doing Business Report: see e.g. L. Enriques and M. Gargantini, ‘Form and Function in Doing Business Rankings: Is Investor Protection in Italy Still So Bad?’, 1 University of Bologna Law Review 1 (2016).
-
150 It was Bismarck who said that the man who wishes to keep his respect for sausages and laws should not see how either is made.
Erasmus Law Review |
|
| Article | In Data We Trust? Quantifying the Costs of Adjudication in the EU Justice Scoreboard |
| Keywords | access to justice, costs of justice, EU Justice Scoreboard, empirical legal research |
| Authors | Adriani Dori |
| DOI | 10.5553/ELR.000209 |
|
Show PDF Show fullscreen Abstract Author's information Statistics Citation |
| This article has been viewed times. |
| This article been downloaded 0 times. |
Adriani Dori, "In Data We Trust? Quantifying the Costs of Adjudication in the EU Justice Scoreboard", Erasmus Law Review, 4, (2021):281-297
|
Affordable and timely judicial proceedings by independent courts are essential for an effective justice system. They are also a precondition for the protection of the rule of law in the EU and for an integrated internal market. Among the tools the European Commission adopts in this field, the EU Justice Scoreboard is key to understanding the empirical basis of the European judicial policies. Created in 2013, it provides annual data on efficiency, quality and independence of member states’ courts. The Scoreboard considers costly judicial proceedings as an obstacle to access to justice. It accordingly benchmarks member states’ performance with various indicators. In the Commission’s view, different national legal traditions should not prevent comparative assessment of member state judicial systems. However, the idiosyncrasies of national systems and the heterogeneity of national judicial statistics inevitably affect this empirical monitoring exercise. A closer look at the Scoreboard data shows that adjudication costs cannot be evaluated through quantitative metrics without contextualisation. This article focuses on the Scoreboard data on judicial costs, from both the supply and the demand side of judicial services. It critically reviews the fact-finding process that supports the preparation of the Scoreboard as well as the data this document displays. In so doing, it tests whether the Scoreboard conveys reliable and comparable information. This analysis is all the more important as the Scoreboard often supports academic analyses on the performance of justice and policy proposals by regulators and lawmakers. |